


THE STATE OF GENEROSITY IN 2025
Widening the Lens
Letter from the Chief Data Officer
GivingTuesday has always celebrated individual giving’s role in meeting community needs. That may seem obvious. Yet at a time when institutional support is becoming less predictable and increasingly displaced, it’s become more important than ever to understand how people and communities care for one another.
For years, our understanding of generosity was shaped by what was easiest to measure: charitable donations, institutional philanthropy, and formal aid. Those systems matter enormously, even if they have never captured the full picture of how people support one another.
A defining story of 2025 in the philanthropy and aid world was the dismantling of USAID, and the ripple effects that followed throughout the global giving ecosystem. There is no question that these changes caused long-term harm to hundreds of worthwhile efforts around the world. But it has also highlighted something that was always true: Formal institutions are only one part of civil society. Surrounding them exists a far broader ecosystem of community care that has always sustained people, even when it has remained largely invisible.
In this report, we see that as governments recede from playing a central role, an intersection of societal generosity and activism are stepping up. Other forms of capital, particularly from individuals, account for a huge portion of what supports aid around the world.
The global political climate often appears to reward myopia and self-interest, but that’s not what we see in the data. People don’t only give when it’s easy or optimistic to do so: They continue to show up for one another, even — or especially — amid uncertainty. The foundation of generosity is proving remarkably resilient.
This echoes a theme we have been exploring for several years: In 2022, “Rethinking Resilience” argued that generosity is not just a response to crisis, it is key to community resilience. In 2024’s “Generosity as Resilience,” we explored how generous action strengthens social cohesion in fractured times. And in countries where there has been political upheaval, like in Britain and the US, community ties have actually strengthened.
This does not mean we can be complacent. We cannot simply assume that individual resilience will compensate for institutional decline. If we do, we'll miss the opportunity to ask whether societal conditions exist to enable people to support one another in the ways they want to.

As the State of Generosity report has evolved, so too has our understanding of generosity. New datasets tell us how people around the world give in multiple ways. We find near-universal multi-modal generosity: Most people give in some form, often in many ways, including volunteering, direct aid, advocacy, and donation. And when people give, they do so across borders, and across differences in politics, identity, and worldview.
It’s often noted that the US population donates more in monetary terms than anywhere else in the world. But when we account for factors like household income, some countries — like Kenya — appear among the most generous around the world. A narrow focus on monetary sums most definitely does not tell the entire story.
I hesitate to describe this as “a post-aid world,” because I would hope that we eventually return to a political environment that once again embraces international cooperation. But beyond the context in which we’re now living, more global data — like that found in this report — can illustrate how people are creating other systems, and how they’re feeling about community care. A better understanding of these support systems can inform new and vital ecosystems, rather than a return to the kind of narrow definitions of resource deployment that characterized legacy philanthropy and aid in the past.
We now see where the new civic infrastructure is going to be. Now it’s imperative that we understand it better and that we find more ways to support it.
Woodrow Rosenbaum
Chief Data Officer
GivingTuesday

Explore the reports

HOW INDIVIDUALS DRIVE GIVING AROUND THE WORLD
Global Aid Flows
Key Takeaways:
While official development aid, like USAID and comparable aid from other countries, has decreased, every other form of giving has increased.
As we have tracked in previous years, giving from individuals dwarfs the amounts allocated by government aid, institutional philanthropy, and corporate philanthropy.
Using new methodology based on household income rather than overall monetary value, we determined the top five most generous countries are Indonesia, Nigeria, Ghana, Kuwait, and Zambia — all located in regions whose generosity is likely undercounted by methods built around Western giving norms.
Higher giving rates tend to show up in countries with stronger civic enabling environments, where organizations can operate freely and philanthropy is legally supported. Where giving rates are lower, this likely reflects the lasting effects of government policies that historically restricted independent civil society, making it difficult for people to donate, organize, or give through formal channels.
The single largest source of global aid is remittances, totaling $690 billion to low- and middle-income countries and directly involving about one in nine people worldwide.
HOW INDIVIDUALS DRIVE GIVING AROUND THE WORLD
World Monetary Giving
For the past two years, we have produced estimates of global monetary flows in giving, using available macro-economic indices.
Using the most recent figures available at the time of publishing, we estimate that nearly two trillion dollars (USD $1.95 trillion) flows worldwide annually to improve people’s lives. We see indications that this number represents some real growth from when we first began compiling this estimate in 2023.
A detailed account of how each component changed is in our technical appendix.
Every form of aid increased in 2025, except for official development assistance (ODA).
Various types of giving driven by individuals and communities rose in 2025. Donations from individuals in the US increased (GivingUSA), as did grants from individuals through donor-advised funds. Giving mediated by US religious congregations increased, as did bequests (donations made through a will) (GivingUSA). Individual giving across all its forms (remittances, donations to nonprofits, bequests, to/through congregations, and using donor advised funds) totalled $1.616 trillion in 2025.
Donations from individuals around the world increased, typically to organizations in the same country, as did remittances, the latter according to the US Federal Reserve.
Total Worldwide Aid Flows (1 box = $2B)
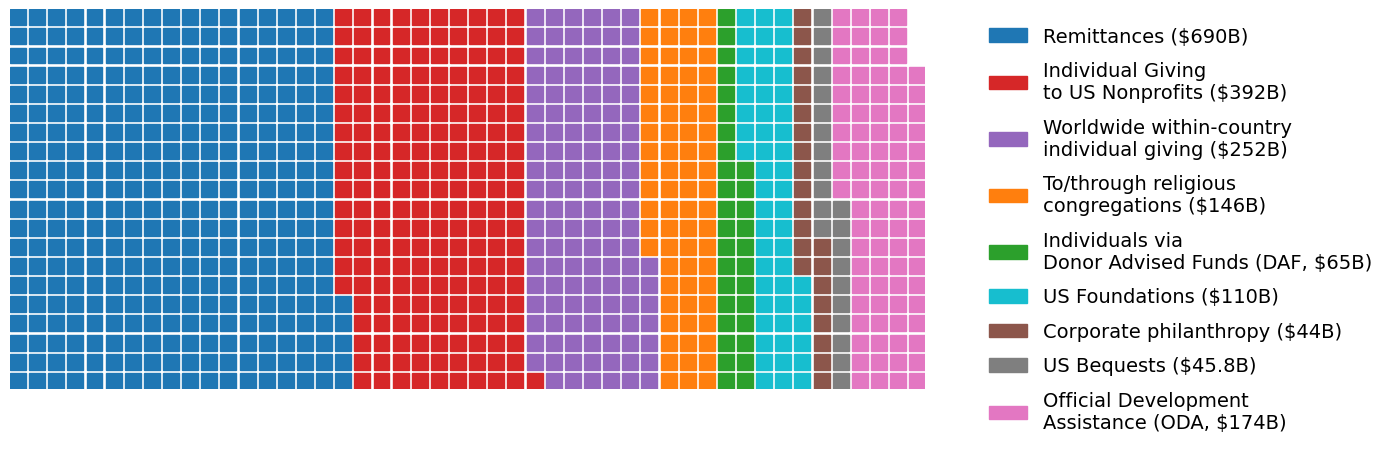
While US foundation grantmaking grew modestly, corporate philanthropy saw a notably stronger increase. ¹
As noted earlier, official development assistance shrank significantly, primarily as a result of the shuttering of USAID as well as cuts to aid from countries in the European Union and beyond.
¹Reported year-over-year (YOY) changes come from Giving USA 2025 analysis of 2023–2024 changes
| Source of money | YoY change (2024 vs 2025) | Amount | Data reference |
|---|---|---|---|
| Individual donations in the US | +4.8% | $396.5B | GivingUSA |
| Individuals outside the US, within-country | +6.2% | $252B* | GivingTuesday estimate, based on CAF WGI |
| US congregational giving (to or through) | +2.1% | $146.5B | Lake Institute |
| US bequests | +7.4% | $45.9B | GivingUSA |
| US corporate philanthropy | +9.1% | $44B | GivingUSA |
| Remittances | +2.8% | $690B* | World Bank / US Federal Reserve |
| US foundation grantmaking | +2.4% | $110B | GivingUSA |
| Donor advised fund (DAF) grants to organizations | +17.9% | $65B | DAF Research Collaborative Update |
| Official development assistance (ODA) | -23.1% | $174B* | OECD |
World Map of Individual Giving
In this year’s report, we wanted to understand where generosity culture is strongest relative to what people have. The world map reflects our best, current understanding of how generosity around the world manifests across a varied landscape of different socioeconomic norms.²
We combined the Charity Aid Foundation's World Giving Index (CAF WGI) with other adjustments from the literature and GDP per capita to estimate individual domestic giving as a percent of total annual household income. This is an expanded look at the $252 billion in our global aid flows chart. This perspective controls for differences in wealth and highlights the effect of cultural norms on generosity³. We can see that generosity culture varies in ways not explained by geography. The 2024 CAF WGI global survey data covers 142 countries⁴ and reports the percent in each country that gave money, volunteered, or helped a stranger in the past year. Giving rates tend to be similar for each country from one year to the next, making it a stable benchmark for level of engagement by country.
Viewed this way, the top five most generous countries are Indonesia (1.23% of household income)⁵, Nigeria (1.16%), Ghana (1.10%), Kuwait (1.01%), and Zambia (1.00%). The United States falls in the upper middle tier at 0.82% of household income⁶. The Philanthropy Roundtable estimates that total charitable contributions from all domestic sources has hovered around 2% for past decades, and that total within-country giving from individuals in the US would fall around 1.2% of GDP.
² An increasing body of evidence (from us and others) points to cultural norms being a major factor in determining why some countries are more generous to others. The effects of religion tend to blend into culture when the vast majority of people belong to a common religion. Religious norms become cultural norms, and even secular citizens adopt similar behaviors. In contrast, religiosity and GDP are inversely correlated and cultures tend to abandon religious norms as the majority of the population stops attending regular religious services (as has been happening in Europe for decades). The US has long been an outlier among countries in that it has higher rates of generosity than one would predict looking at religion. In a sense, its historical religious context has become part of its modern social fabric, and has not declined in Europe.
³ Some relevant papers that informed our model include: National Context, Religiosity, and Volunteering: Results from 53 Countries; 2009Gallup survey on global religiosity; APA Psyc Net’s Religiosity and prosocial behavior at national level; 2019 World Happiness Report, Chapter 4: Happiness and prosocial behavior: An evaluation of the evidence.
⁴ Our estimate excludes the countries shown in gray on the map — mostly in central Africa and some closed societies elsewhere — because CAF's World Giving Index (and Gallup polling, their survey vendor) has no data for them.
⁵ Indonesia also ranks #1 on the CAF WGI list of most generous countries, due to broad population engagement.
⁶ This is a plausible first estimate, as our GivingPulse 2025 data found that only 23% of US households donated more than 1% of their income, and most giving comes from a fraction of households.
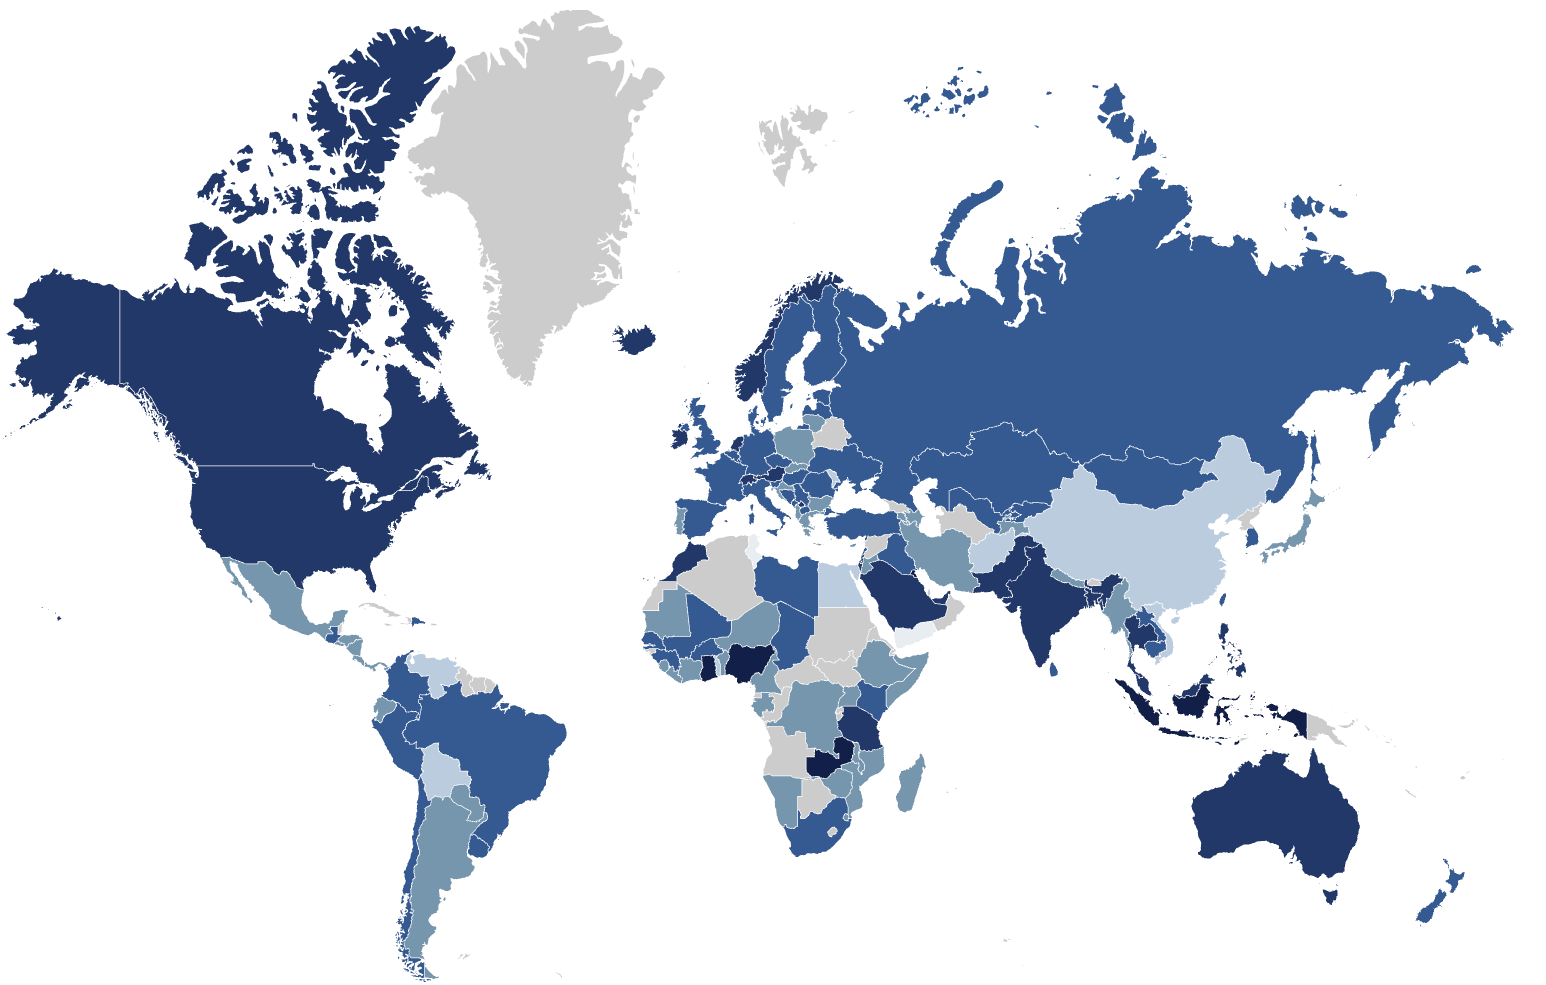

What global trends emerge from the world map? To explore this question, we benchmarked our estimates against the Lilly Family School of Philanthropy's Global Philanthropy Environment Index, which measures how freely organizations can operate in each country. Higher giving rates tend to show up in countries with stronger civic enabling environments, where organizations can operate freely and philanthropy is legally supported.⁷
Where giving rates are lower, this could reflect a variety of influences, such as lasting effects of government policies that historically restricted independent civil society, or other factors that make it difficult for people to donate, organize, or give formally⁸. Research shows these structural constraints can persist for decades after the policies themselves have changed⁹, shaping not just how much people give but how giving gets measured and recorded.
Notably, all five of the most generous countries by our estimate of within-country generosity are in Africa, Southeast Asia, and the Middle East, regions whose generosity is likely undercounted by methods built around Western giving norms¹⁰. As we refine our estimates each year, we hope to better account the generosity from populations living in places where data is scarce.
⁷ Global Philanthropy Environment Index (GPEI), Indiana University Lilly Family School of Philanthropy.
⁸ ICNL (2019). Philanthropy in Russian Society Today& ICNL (2023). China Philanthropy Law Report.
⁹ Paturyan, Y. & Gevorgyan, V. (2021). Still Post-Communist? Testing Howard's Predictions. Springer.
¹⁰ CAF World Giving Index (2024).
Remittance Inflows: Top 5 Countries
Remittances are the single largest source of global aid, totaling $690 billion to low- and middle-income countries¹¹, and directly involving about one in nine people worldwide. The remittance economy affects more people than the populations of the US and EU combined, and each family receiving money from abroad likely affects many others in their community¹² who are not officially counted. The UN estimates that this direct aid addresses at least seven of the 17 Sustainable Development Goals, and totals more than $100 billion annually in direct, long-term community investment that reduces poverty. About 75% of remittances remain with recipient families, paying for immediate needs like food, medicine, school, and utilities. About 50% of global remittances flow to rural areas¹³. In more than 60 countries, remittances account for 3% or more of the gross domestic product, according to the World Bank—much more influential than official development assistance.
Compared against what we observed last year, the same five countries lead the world in remittance inflows. Pakistan led in growth among these, growing 22% in 2024 and 27% in 2025. Saudi Arabia, UAE, Great Britain, and the US are the top countries sending money to Pakistan.
Remittance inflows: Top 5 countries


This year's findings are less a story of unexpected resilience than of previously under-measured resilience. As geopolitical contexts shift the ways communities organize, support one another, and mobilize resources become increasingly central to the future of civil society. The question is no longer simply how we sustain communities and people. It is how we understand, strengthen, and invest in the generosity that has always existed alongside them.
— Asha Curran, CEO GivingTuesday

— Asha Curran, CEO, GivingTuesday

Giving and Civic Intent Trends in 2025
Brazil, Mexico, US, Canada, Great Britain, Kenya, India
Key Takeaways
Giving in any form rose year over year across the seven surveyed countries. The US and Mexico recorded the largest increases in overall giving participation, while Kenya, India, and Brazil each saw slight declines. Kenya and India remain the two highest-participation countries in the sample, with near universal participation.
Growth was uneven across giving types, with volunteering and advocacy increasing more than monetary and item-based giving. Volunteering and advocacy grew slightly faster than the overall participation rate.
Civic Intent scores and giving participation show a consistent relationship across countries. Kenya and India, the two highest-participation countries for giving, also have the largest shares of respondents scoring in the top tiers of Civic Intent. The remaining five countries show a comparatively flatter distribution on both measures.
Willingness to give across ideological lines is high in every country surveyed, with Great Britain consistently the lowest. In all seven countries, a majority of respondents fall into the less polarized segment of the scale. Kenya and India report the highest shares in this segment.
Stability in social fabric indicators masks divergent country-level trends. At the country level, the United States recorded gains across all five Civic Intent indicators, and Mexico showed similar positive movement. Great Britain declined on community belonging and depolarizing attitudes, and Brazil recorded declines across generosity, trust, and belonging measures.
In our seven-country Global Omnibus survey, we continue to ask questions about the extent to which people’s underlying participation in (and motivations about) generosity are holding.
Compared with what we saw in 2024, we continue to see that, regardless of economic pressure, political climate, or cultural context, the overwhelming majority of people find some way to give.
In this section, we look at a few key angles of this question:
Whether generosity is changing: Overall participation is up, but the more interesting story is underneath the topline number. Individual modes of giving (money, items, time, advocacy) are each growing faster than the aggregate, suggesting that people who already give are finding more ways to do it.
How generosity relates to civic belief: Using our Civic Intent framework, we examine how people's sense of obligation to the common good relates to their willingness to help others they disagree with. We find that the countries with the strongest civic commitment are also the most willing to give across ideological lines.
Whether the social fabric is fraying: By tracking five indicators (community belonging, generosity, trust in people, trust in nonprofits, and depolarizing attitudes), we get a more nuanced understanding of civic health in the countries we’ve surveyed.
GIVING AND CIVIC INTENT TRENDS
Across the seven countries we regularly survey (US, Great Britain, India, Kenya, Brazil, Mexico, and Canada), overall giving rates were up slightly in 2025. The overall figure modestly understates the fact that each specific form of giving grew a little more than the total, which indicates that people already participating may be participating in more ways than before.
Country-level trends varied considerably and are examined in detail in the country profiles in Part 3, to be released in released over the coming months. The tables in this section provide the reference data and subsequent profiles interpret what those shifts mean in context.
Giving Rates Increased Slightly, Year-over-Year
| Giving type | 2024 | 2025 | YoY |
|---|---|---|---|
| Any form of giving n=6,024 | 83.3% | 84.6% | +1.3 |
| Gave money n=4,610 | 62.9% | 64.1% | +1.2 |
| Gave items n=5,288 | 73.6% | 74.0% | +0.4 |
| Volunteered time n=3,995 | 54.0% | 55.8% | +1.8 |
| Advocacy n=3,984 | 54.3% | 55.5% | +1.2 |
Giving is near universal: at least four out of five people gave in some form last year, from a low of 80% in Brazil to 99% in Kenya, nearly everybody helps. Between two-thirds and 98% of people gave in two or more forms last year (any combination of money, items, volunteering, or advocacy). People were more likely to have given in all four modes everywhere that we surveyed, than in only one.
The US¹⁴ and Mexico saw the largest increases in participation, while Brazil, India, and Kenya saw slight decreases in overall generosity, measured as a percent of the population engaged. These shifts are best understood in context, as participation in giving is near universal in Kenya and remains exceptionally high in India and Mexico.
¹⁴ In the US, we saw a surprising 9% increase in the percent volunteering, donating items, or advocating in 2025. This is much larger than our observed GivingPulse yearly shifts, based on weekly reporting about past-week activity (a 1.6% increase, similar to the global average YOY change). People in the US appeared to recall giving more in 2025, up 5.3%, compared to 2024. This variance in estimates illustrates a known effect that people are more likely to recall giving money (or doing anything) when asked about the past year, compared to the past week. However, we didn't expect YOY changes to be affected as much (the past recall error should affect both 2025 and 2024 samples). Based on both sources, we conclude that US generosity was up 2–5% in 2025, and largely driven by items, advocacy, and volunteering more than money.
Civic Intent and Willingness to Give Across Ideological Boundaries
Originally developed in 2024, Civic Intent is a composite metric that captures how individuals express their commitment to the common good through recent acts of generosity, community-mindedness, and willingness to help others that they may disagree with. To examine civic trends within each country, we divided people into segments based on where they fell on a 100-point scale, with 80–100 being those who held the most prosocial attitudes and participated in the greatest variety of ways. Kenya and India stand out sharply: the vast majority of respondents in both countries score in the top two tiers (60–100), with very few falling below 40. The other five countries present a flatter picture, with larger shares of their populations in the middle ranges (20–80)¹⁵.
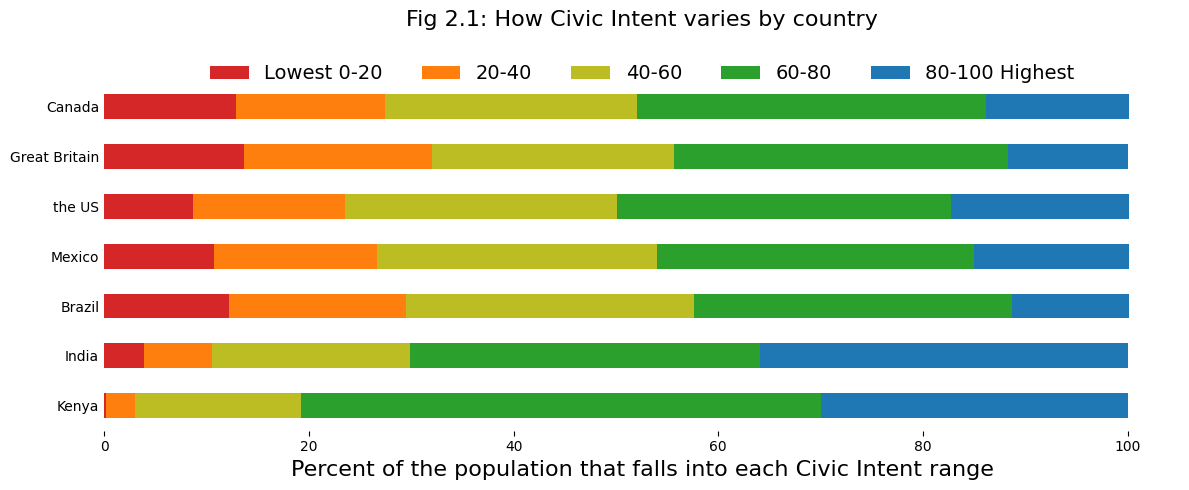
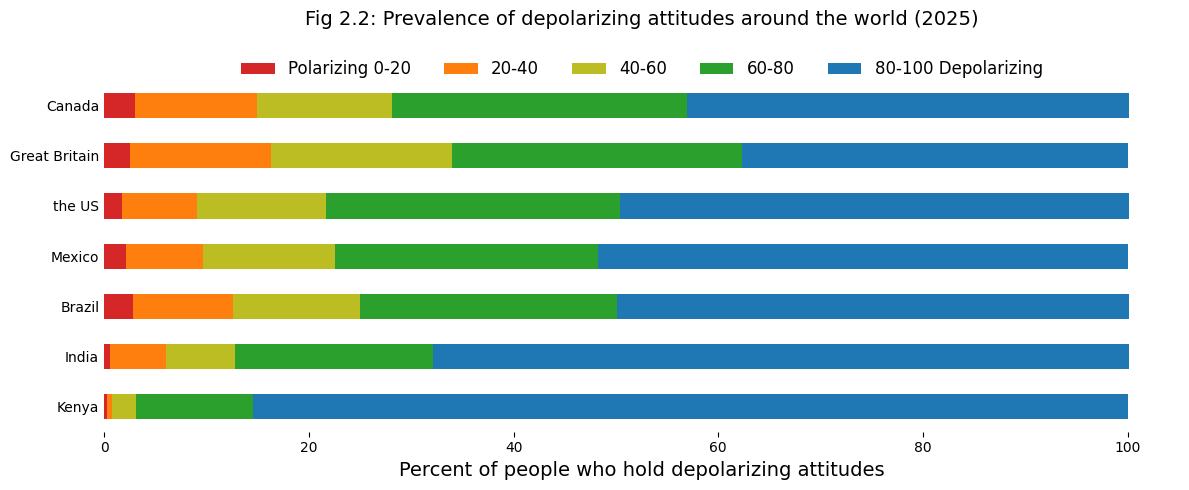
This pattern is consistent with what we see in generosity behavior more broadly: the countries where nearly everyone gives are also the countries where a strong sense of obligation to the common good is most widely held.
We continue to ask a variety of questions about people’s willingness to act generously for the benefit of people with different ideologies or lifestyles. When framed in the context of generous action, we see evidence that most people have an inclusive mindset in who they are willing to help. In every country we survey, the majority of people fall in the less polarized portion of the scale, with Kenya and India having the largest shares of people willing to help across various boundaries. On this aspect of prosociality, Great Britain lags behind other countries.
¹⁵ In our previous state of generosity report we used country average scores instead of quintiles because that allowed us to compare with similar IPSOS measures, but we switched to this analysis because it provides a level of detail and clustering that reflects the kinds of shifts that we could reasonably observe changing from one year to the next, as a result of transformative events.
Understanding the Social Fabric
Civic Intent tracks participants’ sense of obligation to others. To understand whether that sense of obligation is strengthening or eroding, we track five underlying indicators of social fabric: community belonging, generosity in any form, trust in people, trust in nonprofits, and depolarizing attitudes.
Viewed in aggregate, 2025 looks a lot like 2024. But that headline number hides real movement underneath. The United States posted gains across all five indicators, the most consistent positive shift of any country in the study. Mexico moved in a similarly positive direction. Great Britain moved the other way, with falling community belonging and depolarizing attitudes suggesting rising social strain. Canada is the only country where trust in nonprofit declined.
| Metric | Brazil | Canada | India | Kenya | Mexico | The US | Great Britain |
|---|---|---|---|---|---|---|---|
| Community belonging | -0.3 | +1.1 | 0.0 | -1.3 | -0.9 | +4.4 | -1.6 |
| Generosity any form | -2.7 | +2.3 | -1.3 | -0.7 | +4.3 | +5.3 | +1.1 |
| Trust people | -1.9 | +1.3 | -1.3 | -0.4 | +1.7 | +2.0 | -0.3 |
| Trust nonprofits | +0.1 | -1.8 | 0.0 | +2.1 | +2.6 | +1.3 | +0.1 |
| Depolarizing attitudes | +1.1 | +1.0 | -1.1 | 0.0 | +3.6 | +3.8 | -2.5 |
Brazil continued a multi-year softening across generosity, trust, and belonging. India and Kenya were largely stable, with only small shifts in either direction across the five indicators. The lesson: a flat global average can conceal meaningfully different stories happening inside individual countries.
Country-specific trends will be examined in depth in a forthcoming series of country reports to be released over the next month.